* Ray called me at home this morning to ask about Xmath status. Checked status of Xmath requisition when I got in. It is indeed marked as "PO dispatched". Should we ask Purchasing to email us a PDF so we can get it to LeCroy more quickly? Also, should we check Sonya's office to see if the license arrived in a physical package? Ray says he will call LeCroy.
* Guess I should spend most of today continuing to work on material for the journal article.
* I was thinking on the way to work about whether/how we could obtain more accurate GPS times by averaging the relative OCXO/GPS frequency over longer periods than one second and interpolating a best-fit time trajectory. According to the OCXO datasheet, the 1-sec. Allan deviation of the OCXO is nominally 5e-11. So, we'd expect the OCXO's absolute time deviation over n seconds to be 5e-11*sqrt(n/3), I think... So, suppose we averaged the trajectories over a 10,000-second (2.78 hour) period. That gives a time deviation for the OCXO of 2.89 ns. Meanwhile, the Allan deviation for the OCXO vs. GPS for frequencies averaged over that period is (from our 10-day dataset) 2.20e-9. So together, I think this means we should have no worse than about 2.9 ns inaccuracy for absolute times inferred by averaging over that window size.
We can maybe do a little bit better than this if we optimize the window size further. The below graph plots the raw (red) and quantization-error-corrected (blue) values of the Allan deviation, and the expected time deviation due to inherent OCXO instability, as a function of the size of the averaging window. The max of the blue and yellow curves is minimized at a window size of about 6,918 secs. (1.92 hrs.), at which the adjusted relative Allan deviation is 2.41e-9, and the expected OCXO time deviation is 2.40e-9 secs.
 So, what is this saying exactly?
First, the corrected Allan deviation says that, supposing that we measured the OCXO vs. GPS average relative frequency over a ~2 hr. period, we would expect the frequency so measured, even in the absence of any quantization error, to be offset from the actual mean relative frequency over the period consisting of the current 2 hr. period adjoined with the following 2 hr. period by an amount that is distributed with a standard deviation of +/- 2.41e-9, expressed as a multiple of the actual relative frequency. Given a nominal OCXO frequency of 10 MHz, this means that the expected frequency deviation of the OCXO vs. GPS is about 0.0241 Hz. But, the OCXO is really much more stable than that. So the measured relative frequency deviation is actually due almost entirely to variations in the frequency of the PPS signal from the GPS. The GPS PPS signal is supposed to be at 1 Hz, so this means that its average frequency over this size time period is offset from what it ought to be by a standard deviation of 2.41e-9 nHz. Translating frequency deviation to time deviation, this means that (if it were free-running) the GPS's unit's idea of the total time elapsed since the start of this ~2hr period could be off by as much as ~29 microseconds (std. dev.)! This makes sense, particularly with respect to the ~50us size of the phase excursions that we (not infrequently) do see, due to time-lock being lost as a result of the limited sky visibility through our window. However, except at times when time-lock is actually lost and a major (typically many-microsecond) phase excursion is happening, the GPS unit's clock is not really free-running, but is phase-locked with the actual GPS signal from the satellites. So, during such "good" periods, we can expect the actual time deviation of individual PPS pulses could be much less than the 116 nanosecond value. Typically, TRAIM reports that it is; although at present we are not yet confident in these reports. (Since they seem inconsistent with the Allan deviation values we're seeing, which indicate a larger time uncertainty.)
Let's think a little more carefully about how to model all this. First, there is "real" (UTC/USNO) time, flowing (more or less) equably, which the GPS satellites know, and which our GPS module keeps in sync with, albeit imprecisely. The GPS unit includes an internal clock which experiences random frequency fluctuations on short timescales. Our Allan deviation measurements are evidence of this.
However, it occurs to me that I don't really know if our Allan deviation measurements would still be accurate during intervals where time lock isn't lost. I need to redo the Allan deviation calculation for a known "good" interval. The first 40,000 or so seconds of our 10-day run looks pretty good; I should probably redo the Allan deviation calculation just for that portion. Working on that now.
Actually, let's take the 68,000-sec. (~18.9-hr.) interval from 665,000 to 733,000 seconds into the run, which is pretty smooth:
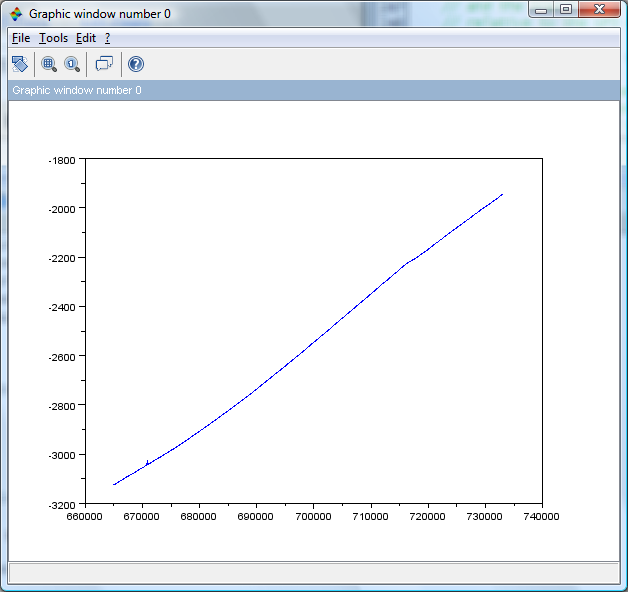 Indeed, when we plot the Allan deviation just for this interval, we find it is much smaller than the overall plot for the entire run:
 In fact, at least for small window sizes, this deviation (blue line) seems to be dominated by the quantization error:
 The yellow line shows the quantization error's contribution to the total Allan deviation, and the green line shows the adjusted version of the blue line if the variance for the quantization error is subtracted from the total Allan variance.
Let's throw in another curve, this one from the first 40k seconds:
 That looks pretty similar to the one from the other "flat" period.
But all this, now, totally throws into question a bunch of my recent conclusions, including the notion that the Allan deviation ought to scale down with 1/sqrt(t) - although it may still do so in some regions of these curves - as well as the impression that the GPS unit's clock had an inherent frequency instability on the order of 1.67e-7 (1-sec). Instead, in the new curves it is as low as 3.14e-8 (@1 sec), or 31.4 ppb. This makes more sense, from the perspective that the GPS clock's phase is being adjusted using the satellites. In fact, it is in line with the typical ~30ns accuracies that we get from the TRAIM algorithm. Actually, just did a measurement of the average nonzero TRAIM accuracy over the 10-day run, and it was 18.1 ns. From quantization error alone, the standard deviation of time error would be 28.9 ns. And the DeLorme doc specifies 62 ns. However, using the 1/sqrt(12) rule gives 17.6 ns, which is pretty close to what TRAIM reports. Actually I should calculate the RMS TRAIM accuracy, OK, that is 21.1 ns, also still close. Probably, however, I should make a worst-case assumption and put it back up at around 60 ns, which is about the documented accuracy from DeLorme as well as the "corrected" accuracy from the 48ks run segment.
Now, this is nice: If we average over 151-s intervals, and use the purple line from the 1st 40ks, we can get theoretically an accuracy of 372 ps. Really meaning, the frequency deviations at that timescale are only 3.72e-10, so if take a frequency measurement based on the last 151s, it should be only 372 ppt from the "real" mean frequency for that timescale... And meanwhile, extrapolating OCXO times over that timescale should only result in time errors of that magnitude. So combining these we might be able to get absolute time accuracy less than a nanosecond! Need to think some more about this... Here's the intersect graph...

No comments:
Post a Comment